What Is SAS? A Beginner’s Guide to SAS Software
SAS is a software platform used to analyze data, create reports, perform statistical calculations, and support business decisions. It helps organizations turn large amounts of information into useful insights. Businesses, healthcare organizations, universities, financial institutions, and research teams use SAS for different data-related tasks.
If you are learning about data analytics or exploring tools used in business intelligence, understanding SAS can help you see how companies work with information. This guide explains what SAS is, how it works, its main features, common uses, advantages, and limitations.
What Is Statistical Analysis System?
SAS stands for Statistical Analysis System. It is a software environment designed for data management, statistical analysis, reporting, and advanced analytics.
SAS helps users organize information, identify patterns, calculate statistics, and present findings in understandable formats. Instead of examining every record manually, analysts can use SAS programs to process data more efficiently.
For example, a retail company might use SAS to study monthly sales, compare product performance, and identify changes in customer purchasing habits. A hospital may use it to analyze research data, while a bank might use analytical models to assess financial risks.
SAS is a commercial software platform developed by SAS Institute. It includes tools for traditional statistical programming as well as modern data management and analytics workflows.
How Does Statistical Analysis System Work?
SAS works by processing data through instructions, analytical procedures, and reporting tools. Users can write programs or use available interfaces, depending on the SAS product and task.
A typical SAS workflow includes the following steps:
1. Collecting Data
The first step is gathering information from sources such as spreadsheets, databases, business applications, or research records. The data may contain sales figures, customer details, survey responses, or financial transactions.
2. Cleaning and Organizing Information
Raw data often contains missing values, duplicate records, or inconsistent formatting. SAS provides tools to prepare information before analysis, helping users work with more reliable datasets.
3. Analyzing Data
After preparing the data, users can perform calculations, summarize records, compare groups, and apply statistical methods. The selected analysis depends on the question being investigated.
4. Creating Reports
can produce tables, summaries, charts, and other analytical outputs. These results help users explain findings to managers, researchers, clients, or other decision-makers.
5. Supporting Decisions
The final results can help an organization understand performance, evaluate possible risks, and make better-informed plans. However, the quality of those decisions depends on the quality of the data and the analysis.
What Is Statistical Analysis System Used For?
SAS is used across many industries because organizations need reliable ways to understand data.
Business and Sales Analytics
Businesses use SAS to examine sales trends, compare performance across locations, measure customer behavior, and prepare management reports. These insights can help teams identify opportunities and understand areas that need improvement.
Healthcare and Medical Research
Healthcare researchers may use SAS to analyze clinical trial data, evaluate research outcomes, and study health-related patterns. In these settings, appropriate data protection and research standards are essential.
Banking and Finance
Financial organizations use analytical tools to examine transactions, evaluate risks, monitor business performance, and support regulatory reporting. SAS can help process complex financial datasets, although results still require proper validation and oversight.
Marketing and Customer Analysis
Marketing teams can use SAS to study campaign performance, divide customers into groups, and understand how different audiences respond to products or services. This information can support more focused marketing strategies.
Education and Research
Universities and research organizations may use SAS to analyze surveys, compare experimental results, and perform statistical calculations. It can be particularly useful when research requires structured and repeatable analytical procedures.
Key Features of SAS Software
SAS offers several features that make it useful for data analysis and reporting.
Data Management
SAS provides capabilities for preparing, transforming, combining, and organizing datasets. Good data management helps analysts reduce errors and make their work easier to reproduce.
Statistical Analysis
Users can apply statistical techniques to summarize information, investigate relationships, and test research questions. The available methods depend on the SAS products and procedures being used.
Reporting and Visualization
SAS can create structured reports and visual presentations. These outputs make complex findings easier to review and communicate.
Automation
Once a SAS program has been written and tested, it can often be reused with updated data. Automation can reduce repetitive work and make regular reporting more consistent.
Advanced Analytics
Depending on the product and configuration, SAS supports capabilities such as predictive modeling, forecasting, and machine learning. These tools help organizations investigate patterns and estimate possible future outcomes.
What Is Statistical Analysis System Programming?
SAS programming means writing instructions in the SAS language to manage and analyze data. A program can import information, select records, calculate summaries, and generate results.
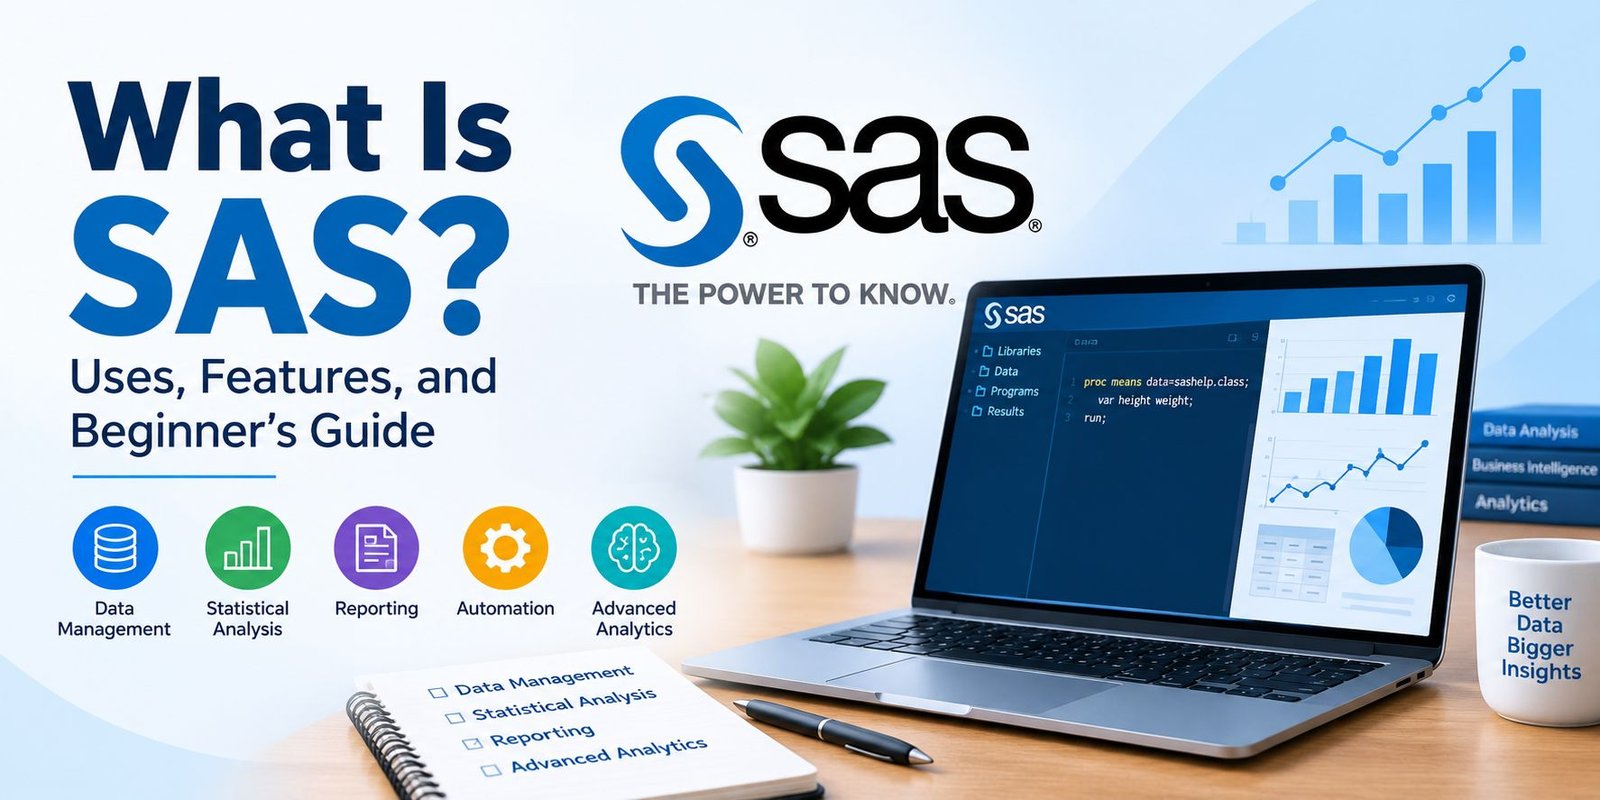
One important part of Statistical Analysis System programming is the DATA step, which is commonly used to create or modify datasets. Procedures, often written using the PROC statement, perform specific tasks such as summarizing data or producing reports.
For example, the following simple program calculates descriptive statistics for a dataset
This example uses a sample dataset included with many SAS installations. It calculates summary statistics for the height and weight variables.
Beginners can start with basic data handling and gradually learn more advanced procedures as their analytical needs grow.
What Is the Difference Between Statistical Analysis System and SQL?
SAS and SQL are related to data work, but they serve different purposes.
SQL, or Structured Query Language, is primarily used to retrieve, filter, combine, and modify data in relational databases. SAS is a broader analytics environment that includes data management, statistical procedures, programming, and reporting.
For example, SQL can retrieve all sales records for a particular month. SAS can then be used to summarize those records, perform statistical analysis, and produce a report.
The two technologies can also work together. The best choice depends on the task, the available systems, and the user’s skills.
What Is the Difference Between Statistical Analysis Systemand Python?
SAS and Python can both be used for data analysis, but their ecosystems differ.
SAS is a commercial analytics platform with integrated tools and support options. Python is a general-purpose programming language with a large collection of libraries for data analysis, automation, visualization, and machine learning.
Python is often attractive to learners who want a flexible, open-source starting point. SAS may be particularly relevant when an employer, research organization, or existing business workflow relies on SAS products.
Neither option is automatically best for every situation. Your decision should consider cost, project requirements, available support, and the tools used in your industry.
What Are the Advantages of Statistical Analysis System?
SAS offers several potential benefits for individuals and organizations.
- Data processing: It provides tools for working with structured datasets and repeatable workflows.
- Statistical capabilities: Users can access a broad range of analytical procedures.
- Reporting: Results can be presented through tables and reports for business or research purposes.
- Automation: Reusable programs can reduce repetitive manual work.
- Business applications: Statistical Analysis System is used in industries that depend on data analysis and reporting.
- Support options: Commercial licensing may include professional support, training, or other services, depending on the agreement.
These advantages can make SAS valuable for teams that need established analytical workflows.
What Are the Limitations of Statistical Analysis System?
SAS also has limitations that beginners should consider.
Licensing Costs
Many Statistical Analysis System products require paid licenses. Costs and available features depend on the specific product and agreement, so users should review current options before choosing a platform.
Learning Curve
Although simple tasks can be straightforward, learning Statistical Analysis System programming and statistical concepts takes time. Complex analytical projects may require substantial technical knowledge.
Alternative Tools
Open-source tools such as Python and R provide other ways to perform data analysis. Some users may prefer these alternatives because of their cost, flexibility, or community-developed libraries.
Product Differences
Statistical Analysis Systemis a family of products rather than a single identical application. Features, interfaces, and deployment options can vary between SAS 9, SAS Viya, and other offerings.
Is Statistical Analysis System Free to Use?
SAS is primarily known as commercial software, but free learning and access options may be available for eligible users. These options can change over time and may have different feature limits.
Students and beginners should check the official SAS website for current educational resources, training, and available software access. Before using SAS for professional work, confirm whether the selected option allows your intended use.
Is Statistical Analysis System Difficult to Learn?
Statistical Analysis System can be learned by beginners, especially when they start with simple datasets and practical exercises. You do not necessarily need to be an experienced programmer to begin exploring basic SAS concepts.
A useful learning path is to understand datasets and variables, practise the DATA step, learn common procedures, and then move toward statistical analysis and reporting. Basic knowledge of statistics can also make it easier to understand analytical results.
Consistent practice is generally more effective than trying to learn every feature at once.
Who Should Learn Statistical Analysis System?
SAS may be useful for:
- Students studying statistics, analytics, or related subjects.
- Data analysts who work with Statistical Analysis System-based systems.
- Researchers who need statistical analysis tools.
- Business professionals who prepare data-driven reports.
- People applying for roles where Statistical Analysis System is listed as a required or preferred skill.
Before investing heavily in learning Statistical Analysis System, review job descriptions and industry requirements in your target field. This can help you decide whether Statistical Analysis System should be your first analytics tool or a skill to add later.
Frequently Asked Questions
What does Statistical Analysis System stand for?
SAS stands for Statistical Analysis System, a software environment used for data management, statistical analysis, and reporting.
Is Statistical Analysis Systema programming language?
SAS includes its own programming language, which users can employ to prepare data, run analytical procedures, and create reports.
Is Statistical Analysis System used for data analytics?
Yes. SAS is used for data analytics, statistics, reporting, predictive modeling, and other data-related tasks, depending on the product.
Is Statistical Analysis System better than Python?
Neither is universally better. SAS may suit organizations that rely on its commercial analytics platform, while Python offers a flexible, open-source ecosystem. The right choice depends on your goals and requirements.
Can beginners learn Statistical Analysis System?
Yes. Beginners can start with simple datasets and basic procedures, then gradually learn more advanced programming and statistical methods.
Is Statistical Analysis Systemstill useful?
SAS remains relevant in organizations and industries that use its analytics products. Its value for an individual learner depends on employer requirements, career goals, and the alternatives used in their field.
Conclusion
Statistical Analysis System is a data analytics platform that helps users organize information, perform statistical analysis, automate tasks, and create reports. It is used in business, finance, healthcare, education, and research.
Learning Statistical Analysis Systemcan be worthwhile if your studies or career involve organizations that use the platform. Beginners should start with fundamental programming concepts, practise on sample datasets, and explore how SAS compares with alternatives such as Python and R.
The most useful tool is the one that fits your analytical needs, available resources, and long-term goals.