
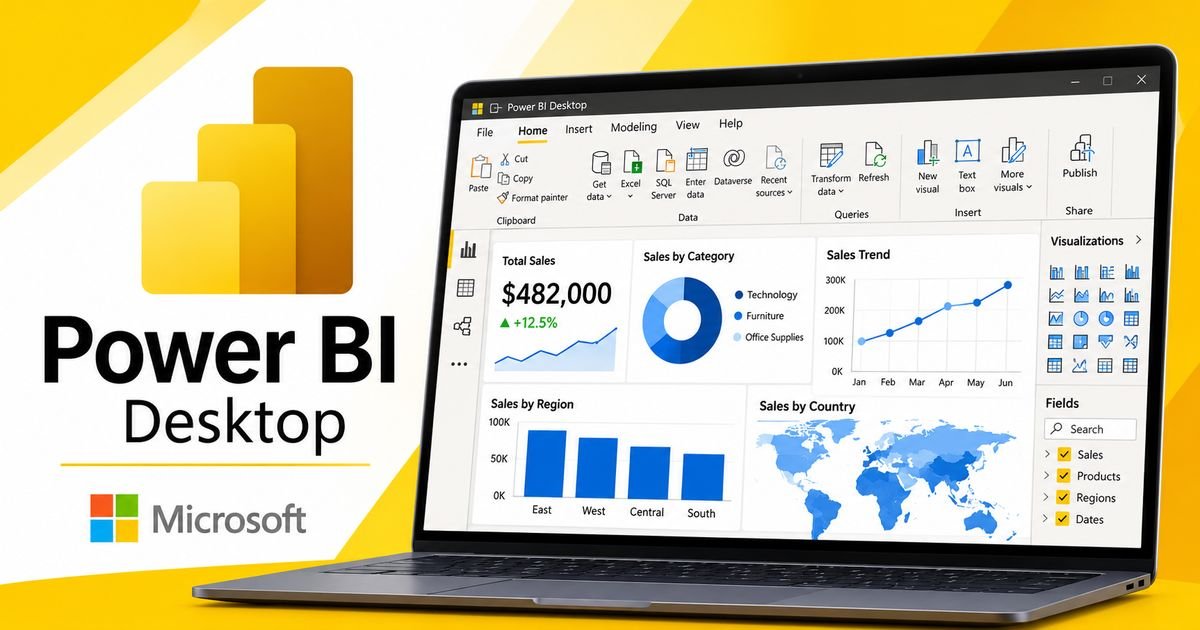
Power BI Desktop: A Guide to Data Analysis and Reporting
Businesses generate enormous amounts of information every day. Sales transactions, customer records, financial documents, website activity, and operational reports all contribute to the growing amount of data that organizations need to manage. However, collecting information does not automatically make it useful. Companies must organize, examine, and understand their data before they can make informed decisions.
Power BI Desktop provides a practical solution for this challenge. Developed by Microsoft, this business intelligence application helps users transform information from different sources into meaningful reports. It combines data preparation, analytical calculations, data modeling, and interactive visualization in one desktop environment.
Unlike traditional reporting methods, Power BI Desktop allows users to explore information through interactive charts, filters, and visual elements. As a result, people can investigate business performance without manually reviewing every record in a spreadsheet.
The application supports beginners who want to learn data analysis as well as experienced professionals who manage complex reporting projects. Its integration with Microsoft technologies also makes it useful for organizations that already depend on Excel, SQL Server, and cloud-based services.
This guide explores Power BI Desktop from a different perspective. It covers its working environment, analytical capabilities, report development process, practical applications, advantages, limitations, and important considerations for new users.
Understanding the Purpose of Power BI Desktop
Power BI Desktop is a business intelligence application designed to help users analyze information and create interactive reports.
Its main purpose is to convert disconnected or difficult-to-understand datasets into organized analytical information.
Consider a company that operates several stores. Each location generates its own sales records, customer information, inventory updates, and financial data. Reviewing these records separately can make it difficult for management to understand overall performance.
Power BI Desktop helps bring this information together.
Users can connect supported sources, organize the imported information, establish relationships between datasets, and create visual reports. These reports can reveal patterns that may not be immediately visible in raw records.
For example, management may discover that one product category performs particularly well during certain months. Another report may show that a particular location generates more revenue than other branches.
These findings can support discussions about inventory, marketing, and business operations.
Importantly, Power BI Desktop does not automatically make business decisions. Instead, it gives users a structured way to examine information and understand what the available data suggests.
The Role of Power BI Desktop in Modern Data Workflows
Data analysis involves several activities. These include collecting information, checking its quality, organizing records, performing calculations, and communicating findings.
Power BI Desktop supports many of these activities within one application.
In a typical workflow, information begins in an external source. It may come from an Excel workbook, a database, or another supported platform.
The user then connects that source to Power BI Desktop.
Afterward, the information can be prepared through Power Query. Users can correct data types, remove unnecessary fields, combine datasets, and perform other transformations.
Once the information is ready, it can be organized into a data model. Relationships connect related tables, while DAX expressions provide additional calculations.
Finally, users create report pages containing visualizations that explain the results.
This process helps establish a repeatable reporting workflow.
For organizations that produce reports regularly, repeatability is especially valuable. Instead of rebuilding the entire report every time new information arrives, users can refresh supported connections and update the existing analysis.
Exploring the Power BI Desktop Workspace
The Power BI Desktop interface contains several working areas. Each area supports a different part of the analytical process.
Understanding these sections makes it easier to navigate the application and manage projects.
Report Development Environment
The report development environment is where users arrange visual elements and create report pages.
It provides a canvas for displaying charts, graphs, cards, text, and other supported components.
Users can resize visualizations, adjust formatting, and organize different sections according to the report’s purpose.
For example, a business performance report may begin with important financial indicators. Additional pages can display product comparisons, customer activity, and regional performance.
The goal is to make important information easy to locate.
Data Inspection Environment
Power BI Desktop also provides a way to inspect information stored in the model.
This is useful when users need to verify imported records or investigate unexpected values.
For instance, an analyst may notice that a chart displays an unusual sales figure. Inspecting the underlying information can help identify whether the result comes from an incorrect source value, a relationship issue, or a calculation.
Checking the data before publishing a report is an important part of responsible analysis.
Model Management Environment
The model view provides a visual representation of relationships between tables.
This area becomes particularly important when a project uses information from several sources.
Users can examine how tables connect and manage relationships between related fields.
A clear model makes it easier to understand where report values come from and how calculations interact with different datasets.
Working With Different Data Sources
One of the most useful capabilities of Power BI Desktop is its ability to connect with different information sources.
Businesses rarely store all their information in one place. Financial records may exist in spreadsheets, customer information may be stored in databases, and operational data may come from cloud platforms.
Power BI Desktop helps users work with supported sources through its available connectors.
Spreadsheet-Based Information
Excel remains a common source of business information.
Many departments use spreadsheets to maintain budgets, employee records, sales information, and inventory lists.
Power BI Desktop can connect to supported Excel workbooks and use their contents for reporting.
This makes it easier to move from traditional spreadsheet reporting toward interactive business intelligence.
Database Connections
Organizations that maintain large information systems often store records in databases.
Power BI Desktop supports several database connection options, including SQL Server.
Depending on the source, users may work with imported information or supported live connection methods.
Database connectivity is useful because it allows analysts to work with structured information without manually copying every record into a spreadsheet.
Text and CSV Files
CSV files are commonly used to exchange structured information between applications.
Power BI Desktop can import supported CSV and text files for analysis.
These files may contain customer records, transaction histories, product information, or other structured datasets.
Before building reports, users should check delimiters, column names, data types, and missing values.
Cloud-Based Sources
Modern organizations increasingly depend on cloud applications.
Power BI Desktop supports various cloud and online data sources through its connectors.
These connections can help analysts combine business information from different systems.
However, available functionality depends on the connector, account permissions, authentication requirements, and source configuration.
Transforming Raw Information Into Useful Data
Importing information is only one part of a successful reporting project.
Real-world datasets frequently contain inconsistencies. Some records may have missing values, while others may use different date formats or inconsistent category names.
Power BI Desktop provides Power Query Editor to help users prepare this information.
Removing Unnecessary Information
A dataset may contain columns that are not relevant to the current analysis.
For example, a sales report might need product names, order dates, quantities, and revenue. Other fields may not contribute anything useful to the report.
Removing unnecessary columns can simplify the model.
It may also reduce the amount of information that needs to be processed.
Correcting Data Types
Data types determine how information is interpreted.
A date should be recognized as a date rather than ordinary text. Similarly, numerical values should use appropriate numeric formats.
Incorrect data types can cause unexpected results in calculations and visualizations.
Therefore, users should review data types during preparation.
Handling Missing Values
Missing information is common in business datasets.
For example, a customer record may not contain a phone number, or a transaction may have an incomplete optional field.
Users should investigate missing values before deciding how to handle them.
Depending on the situation, they may remove unsuitable records, preserve blank values, or apply an appropriate transformation.
The correct approach depends on the meaning of the information.
Combining Information
Power Query can combine information from supported sources.
For instance, a business may receive separate monthly files containing similar sales records.
Users can append compatible datasets to create a combined collection of transactions.
They can also merge tables when matching fields connect information from different sources.
These features reduce repetitive preparation work.
Creating Repeatable Transformations
Power Query records transformation steps.
This allows supported operations to run again when information is refreshed.
For recurring reports, this can save considerable time.
Instead of manually cleaning every new spreadsheet, users can maintain a preparation process that applies the required steps consistently.
Building a Reliable Data Model
A data model determines how information is organized and connected inside Power BI.
Its structure has a major influence on report accuracy and performance.
A project with several disconnected tables may produce confusing results. Similarly, incorrect relationships can lead to misleading calculations.
Therefore, data modeling deserves careful attention.
Understanding Fact Tables
Fact tables generally contain measurable business events.
Examples include sales transactions, website visits, payments, and product orders.
These tables often contain numerical values that users want to analyze.
A sales fact table might include transaction dates, product identifiers, customer identifiers, quantities, and revenue.
Understanding Dimension Tables
Dimension tables provide descriptive information about the records in a fact table.
A product dimension may contain product names, brands, and categories.
A customer dimension may contain customer classifications or other appropriate descriptive fields.
These tables help users examine business activity from different perspectives.
Creating Relationships
Relationships connect related tables through matching fields.
For example, a product identifier in a sales table may connect to a product identifier in a product table.
This relationship allows Power BI to use product descriptions when analyzing sales transactions.
However, relationships must be designed carefully.
Incorrect relationship directions, duplicate keys, or unsuitable cardinality settings can affect analytical results.
Why Star Schema Matters
Star schema is a widely used approach to analytical data modeling.
It generally places a central fact table around related dimension tables.
This structure can make models easier to understand and maintain.
It also provides a useful foundation for many Power BI reporting projects.
Although not every dataset follows a perfect star schema, understanding the approach can help beginners build more organized models.
Understanding DAX and Analytical Calculations
Data Analysis Expressions, commonly called DAX, is a formula language used in Power BI.
It allows users to create calculations that respond to the current report context.
DAX is especially useful when ordinary imported columns do not provide everything required for an analysis.
Creating Measures
Measures calculate values based on the current filter context.
For example, a total revenue measure can calculate the combined value of transactions.
A simple DAX expression might look like this:
Total Revenue = SUM(Sales[Revenue])This measure can be placed in a card, chart, or other supported visualization.
Its result can change when users apply report filters.
Calculated Columns
Calculated columns create additional values for individual rows in a table.
For example, an analyst may create a category based on existing information.
Unlike measures, calculated columns are evaluated for rows and stored in the model.
Understanding the difference between measures and calculated columns is important when designing analytical projects.
Filter Context
Filter context determines which information a DAX calculation evaluates.
For example, a total revenue measure may return different results when a user selects a particular region.
The measure itself may remain unchanged, but the selected filters affect its output.
This is one of the most important concepts in DAX.
Learning Advanced Calculations
Advanced DAX can support more detailed analysis.
Users can create time-based calculations, comparisons, percentage changes, and other analytical measures.
However, complex formulas require a good understanding of the underlying data model.
Beginners should start with simple measures before moving toward advanced expressions.
Creating Reports That Communicate Clearly
A report should do more than display numbers.
Its main purpose is to help people understand important information and identify meaningful patterns.
Power BI Desktop offers several visual elements for presenting different types of data.
Comparing Categories
Bar and column charts are useful for comparing categories.
A retail analyst may use a bar chart to compare revenue across product groups.
This makes it easier to identify which categories contribute the most to overall performance.
Examining Changes Over Time
Line charts are useful when information changes across dates or periods.
For example, a finance report may show monthly revenue over several years.
The visualization can help viewers identify increases, decreases, and recurring patterns.
Highlighting Important Indicators
Card visuals can display important numerical values.
These may include total revenue, number of orders, average transaction value, or customer count.
Cards are useful when viewers need to understand important figures quickly.
Exploring Geographic Information
Map visualizations can help present location-based information when the relevant data and supported visual features are available.
For example, an organization may examine sales distribution across different regions.
Location information should be accurate and appropriately formatted for reliable geographic reporting.
Showing Detailed Records
Tables and matrix visuals help users inspect detailed information.
They can display multiple fields together and support certain interactive reporting features.
These visuals are useful when the audience needs to examine individual values rather than only summary statistics.
Interactive Reporting and User Exploration
One important advantage of Power BI Desktop is that reports do not have to remain static.
Users can interact with supported visualizations to explore different parts of a dataset.
Slicers
Slicers provide visible controls for filtering reports.
A sales report might include a date slicer that allows users to select a particular period.
Another slicer could allow viewers to focus on a product category.
This makes the report more flexible.
Cross-Filtering
Power BI supports interactions between visualizations.
Selecting a category in one chart can affect other visuals on the same report page, depending on their interaction settings.
For example, selecting a product category may update a revenue chart and a customer summary.
This allows viewers to investigate connections without opening separate reports.
Drill-Down Navigation
Drill-down helps users explore information at different levels.
A chart may begin with annual sales and allow viewers to examine quarters and months.
This is useful when someone wants to move from an overview toward more detailed information.
Drill-Through Pages
Drill-through allows a report to provide additional details about a selected item.
For example, a summary page may show overall product performance.
A separate page can display more detailed information about the selected product.
This approach helps keep the main report organized while still offering deeper analysis.
Real-World Applications of Power BI Desktop
Power BI Desktop is useful in many professional environments.
Its flexibility allows different departments to create reports according to their specific needs.
Business Operations
Operations managers can use reports to monitor productivity, order processing, delivery performance, and resource utilization.
These insights can help identify areas that need additional attention.
For example, a report may reveal that order processing takes longer during particular periods.
Managers can investigate the underlying operational conditions and consider suitable improvements.
Financial Management
Financial teams can organize revenue, expenses, budgets, and other accounting information.
Reports can help compare actual figures with planned targets.
They may also display spending patterns and financial trends.
However, important financial conclusions should always be checked against the underlying accounting records.
Customer Analysis
Businesses often want to understand customer behavior.
Power BI reports can organize supported customer information into useful analytical views.
For example, users may examine customer groups, order frequency, and purchasing trends.
This can support discussions about customer service and business planning.
Supply Chain Monitoring
Supply chain teams work with information about suppliers, deliveries, inventory, and distribution.
Power BI can help bring supported information together for reporting.
A report may display delivery performance or changes in inventory levels.
These insights can help teams investigate operational problems.
Website Performance
Organizations can also analyze website-related information.
Supported datasets may contain visitor activity, page performance, traffic sources, and other digital indicators.
Power BI can present this information in organized reports.
The quality of the analysis depends on the accuracy and completeness of the connected data.
Power BI Desktop for Students and Independent Learners
Power BI Desktop is not limited to professional business environments.
Students and independent learners can use it to develop practical data analysis skills.
Learning Through Sample Datasets
Beginners can start with publicly available sample datasets or their own practice spreadsheets.
These sources provide an opportunity to learn how data is imported and organized.
Developing Analytical Thinking
Creating a report encourages users to ask questions about information.
For example, a student analyzing a sales dataset might investigate which category performs best or how results change over time.
This process develops analytical thinking.
Building a Portfolio
Students can create small reporting projects to demonstrate their abilities.
A portfolio may contain examples of financial analysis, sales reporting, or inventory monitoring.
However, users should avoid publishing private or confidential information.
Preparing for Data Careers
Learning Power BI can support people interested in business intelligence and data analysis.
It introduces concepts such as data preparation, relationships, calculations, and reporting.
These skills may also help learners understand other analytical technologies.
Improving Report Performance
A report should remain responsive and reliable as its dataset grows.
Poorly organized models can make reports slower and harder to maintain.
Fortunately, several practices can help improve performance.
Remove Unused Columns
Do not import every available field automatically.
Review the dataset and retain information that contributes to the analysis.
This can reduce unnecessary model complexity.
Use Suitable Data Types
Correct data types help Power BI process information appropriately.
They also reduce confusion during calculations and visualization development.
Avoid Unnecessary Calculated Columns
Calculated columns can increase model size.
Where appropriate, measures may provide a more suitable way to perform calculations.
The choice depends on the reporting requirement.
Review Relationships
Check for unnecessary or incorrect relationships.
A clear model can reduce unexpected results and simplify troubleshooting.
Keep Visualizations Focused
Too many visual elements can make a report difficult to use.
Use only the charts and filters that support the report’s main purpose.
A focused design often improves both readability and usability.
Publishing and Sharing Power BI Reports
Power BI Desktop focuses on local report development.
When a report is ready, users may publish it to Power BI Service.
The online service provides features for accessing and managing supported Power BI content.
Publishing generally involves signing in with an appropriate account and selecting an available workspace.
After publication, users can manage access according to their permissions and licensing arrangements.
Organizations should carefully review their sharing policies before distributing business reports.
Sensitive information should only be available to authorized viewers.
It is also important to understand that a report file and a published online report are not exactly the same thing.
The desktop file is used for development and local work, while the online service provides additional collaboration and management capabilities.
Security and Responsible Data Management
Business intelligence projects often involve confidential information.
Therefore, users should consider security from the beginning.
Only connect to sources that you are authorized to access.
Protect account credentials and avoid sharing sensitive report files through unsecured channels.
Organizations should also establish suitable access permissions.
Power BI includes security capabilities within its wider platform. These can support controlled access when configured correctly.
Row-level security, for example, can restrict the records visible to different users.
However, security settings require careful planning and testing.
Users should also follow applicable privacy requirements when working with customer, employee, financial, or healthcare information.
Common Challenges When Learning Power BI Desktop
New users may encounter several difficulties when starting their first reporting projects.
Understanding these challenges can make the learning process easier.
Confusing Data Relationships
Beginners sometimes create relationships without fully understanding how tables connect.
This can produce unexpected totals or incorrect visualizations.
Start with simple models and learn how matching keys work.
Difficulty With DAX
DAX can be challenging because calculations respond to filters and evaluation context.
Begin with basic functions and gradually explore more advanced expressions.
Poor Data Quality
Incomplete or inconsistent source information can affect the entire report.
Spend time preparing data before creating visualizations.
Overcomplicated Report Design
Adding too many charts can make a report confusing.
Focus on the questions that the report needs to answer.
Publishing and Permission Issues
Publishing may involve account, workspace, licensing, and access requirements.
Review the relevant Microsoft documentation before planning an organization-wide sharing process.
Is Power BI Desktop Worth Learning?
Power BI Desktop is worth considering for people who regularly work with structured information.
It provides a combination of data preparation, modeling, calculations, and interactive reporting capabilities.
Students can use it to build practical analytical skills.
Business professionals can use it to understand organizational performance.
Data analysts can use it to create repeatable reporting workflows.
However, the value of learning Power BI depends on individual goals.
Someone who only needs basic spreadsheet calculations may not require every feature.
On the other hand, someone who regularly combines multiple datasets and creates reports may benefit considerably from learning the application.
The best approach is to begin with a small project and expand knowledge through practical experience.
Frequently Asked Questions
What Is Power BI Desktop Mainly Used For?
Power BI Desktop is used to prepare information, create data models, perform calculations, and build interactive reports. It helps users understand datasets through visual analysis.
Who Developed Power BI Desktop?
Microsoft developed Power BI Desktop as part of its wider Power BI business intelligence platform.
Can Beginners Learn Power BI Desktop?
Yes. Beginners can start with simple Excel files, basic charts, and straightforward reports. More advanced features can be learned gradually.
Does Power BI Desktop Support SQL Databases?
Yes. It supports SQL Server and other supported database connections. The available connection methods depend on the selected source.
What Is the Difference Between Power Query and DAX?
Power Query is mainly used to connect, clean, and transform information before loading it into the model. DAX is used to create calculations within the data model.
What Is a PBIX File?
A PBIX file is the common Power BI Desktop project format. It can contain report pages and model information, depending on how the project was created.
Can Power BI Desktop Work Without the Internet?
Some local reporting activities can be completed without an active internet connection after the application and required data are available. However, online connections and publishing features require appropriate connectivity.
Is Power BI Desktop Suitable for Small Businesses?
Yes. Small businesses can use it to examine sales, expenses, inventory, and other operational information. The application can support reporting needs across different business sizes.
Does Power BI Desktop Automatically Update Reports?
Reports can be refreshed when supported data sources provide updated information. The refresh process depends on connection settings and source availability.
What Skills Are Useful for Power BI?
Useful skills include spreadsheet knowledge, data preparation, basic mathematics, data modeling, and analytical thinking. DAX becomes increasingly important for advanced reporting.
Can Power BI Desktop Replace Excel?
Not completely. Excel and Power BI serve different purposes. Excel is useful for spreadsheet management and calculations, while Power BI focuses on business intelligence and interactive reporting.
What Is a Power BI Dashboard?
A Power BI dashboard is an online, single-page view of important information in Power BI Service. It is different from a multi-page report created in Power BI Desktop.
Is Power BI Desktop Good for Business Intelligence?
Yes. It provides tools for preparing, modeling, analyzing, and presenting information, making it useful for many business intelligence projects.
Can Power BI Desktop Connect to Multiple Sources?
Yes. Users can connect to multiple supported sources and combine their information through appropriate data preparation and modeling processes.
How Can I Improve My Power BI Skills?
Practice with sample datasets, learn Power Query, understand data relationships, study basic DAX, and build complete reporting projects. Practical experience is one of the best ways to improve.
Conclusion
Power BI Desktop provides a flexible environment for turning business information into understandable and interactive reports. Its capabilities extend beyond basic chart creation. Users can connect different sources, prepare raw records, build organized data models, create analytical calculations, and develop reports that answer important business questions.
The application is useful across industries, from retail and finance to education, marketing, and operations. It also provides valuable learning opportunities for students and people interested in data-related careers.
Although advanced features require practice, beginners can start with simple datasets and gradually develop their skills. Understanding Power Query, relationships, DAX, and report design creates a strong foundation for more complex projects.
Ultimately, successful reporting depends on more than the software itself. Accurate information, suitable calculations, thoughtful design, and responsible data management all contribute to reliable results. When these elements work together, Power BI Desktop becomes a useful tool for understanding information and supporting informed decisions.
SEO Title
Power BI Desktop: A Guide to Data Analysis and Reporting
Meta Description
Discover Power BI Desktop features, data modeling, DAX, Power Query, interactive reports, business applications, and practical analytics tips.






One Comment