
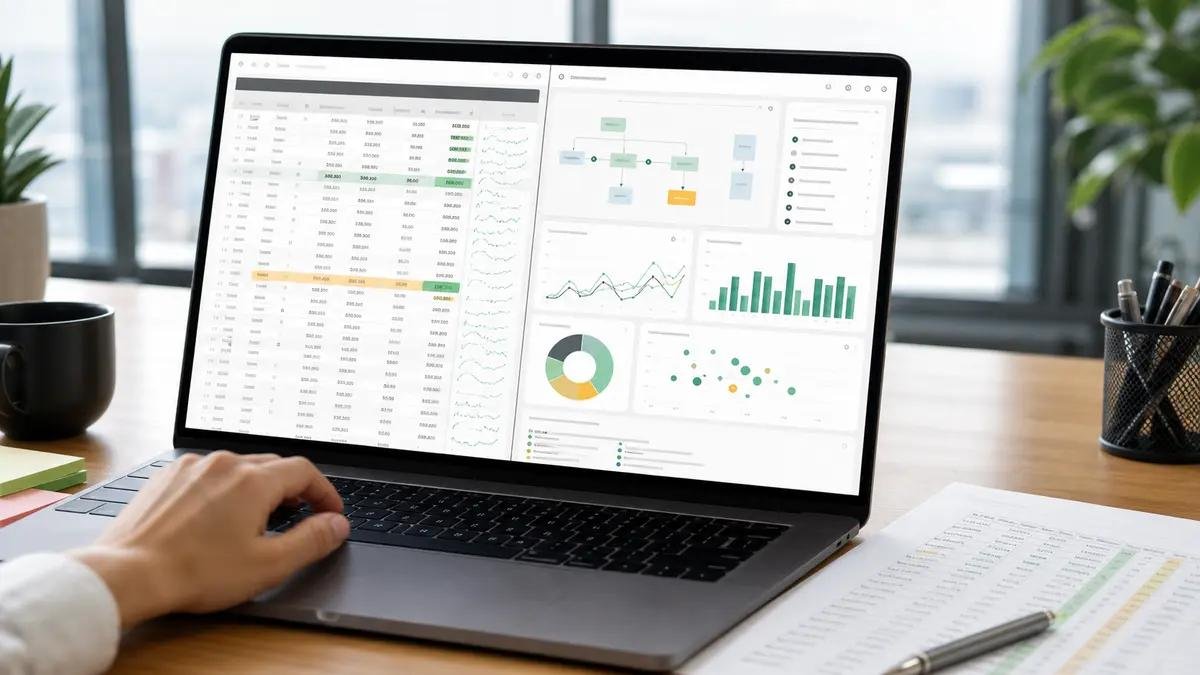
What Is Data Analysis? A Complete Guide for Beginners
Every day, people and organizations generate information through online purchases, mobile applications, surveys, business transactions, and many other activities. This information can reveal useful details, but only when it is examined carefully. Data analysis provides a way to understand these details and use them to solve problems.
From small businesses tracking their expenses to researchers studying scientific results, data analysis supports a wide range of activities. It helps people understand what is happening, recognize patterns, investigate unexpected results, and make more informed choices.
Learning about data analysis can be useful for students, business owners, marketers, researchers, and anyone interested in working with information. This guide explains the meaning of data analysis, its major types, the steps involved, commonly used tools, and examples of how it works in practice.
What Is Data Analysis?
Data analysis is a systematic way of examining information to discover useful patterns, answer questions, and draw conclusions. It involves preparing data, organizing it into a suitable format, applying analytical methods, and interpreting the results.
The information being studied can be numerical or descriptive. Numerical data might include product prices, monthly expenses, website visits, or examination scores. Descriptive data could include customer opinions, interview responses, written reviews, or observations.
Consider a small business that sells handmade products online. The owner records every order but does not know which products perform best. By organizing the records and comparing sales across different products, the owner can identify popular items and investigate products with fewer purchases.
This is a simple example of data analysis. The goal is not merely to collect numbers; it is to understand what those numbers can tell us.
Data analysis can involve basic spreadsheet calculations or advanced statistical techniques. The appropriate method depends on the question, the available information, and the level of detail required.
Why Do People Use Data Analysis?
People use data analysis because it helps them understand situations more clearly and evaluate possible decisions. Instead of relying only on personal opinions, they can consider evidence gathered from relevant information.
Improving Business Performance
Businesses can examine revenue, costs, customer activity, and product performance. These findings may help managers identify waste, improve services, and decide where additional resources are needed.
Understanding Customer Needs
Customer surveys, purchase histories, and product reviews can reveal preferences and recurring complaints. Companies can use these findings to improve their offerings, provided they handle customer information responsibly.
Solving Problems
When an unexpected change occurs, data analysis can help narrow down possible explanations. For example, a sudden rise in product returns may encourage a business to examine manufacturing quality, packaging, delivery conditions, or product descriptions.
Planning for the Future
Historical records can help organizations estimate future demand, prepare budgets, and consider potential risks. Such estimates are useful for planning, although they cannot remove uncertainty.
Measuring Progress
Organizations can compare actual performance with their goals. A marketing team, for instance, may examine whether a new campaign increased qualified website visits or completed purchases.
What Are the Different Types of Data Analysis?
Data analysis includes several approaches. Each approach focuses on a particular kind of question, and multiple approaches may be combined within one project.
1. Descriptive Analysis
Descriptive analysis summarizes information to provide an overview of past events or current conditions.
A grocery store might calculate its daily sales, identify its busiest hours, or compare the revenue generated by different product categories. These summaries make large collections of records easier to understand.
Common techniques include totals, averages, percentages, frequency counts, tables, and charts.
Descriptive analysis explains the available results without necessarily determining why they occurred.
Main question: What happened?
2. Diagnostic Analysis
Diagnostic analysis explores possible reasons behind an observed result. It involves examining differences, relationships, and changes that may explain a particular outcome.
Suppose a company notices that customer complaints have increased. An analyst could compare complaint categories, product batches, delivery records, and customer service response times to identify areas that deserve closer investigation.
The findings may suggest a likely explanation, but further evidence could be needed to establish the actual cause.
Main question: Why might it have happened?
3. Predictive Analysis
Predictive analysis uses historical information and analytical models to estimate future events or outcomes.
An online retailer could study previous seasonal sales, current stock levels, and customer demand to estimate how many products might be needed during an upcoming shopping period.
Predictive results are estimates rather than guaranteed outcomes. Unexpected events, changing customer preferences, and incomplete data can affect their accuracy.
Main question: What may happen next?
4. Prescriptive Analysis
Prescriptive analysis evaluates possible decisions and their expected consequences. It may use optimization techniques, simulations, or mathematical models to compare alternatives.
For example, a delivery service might compare different schedules to reduce travel costs while maintaining acceptable delivery times.
The final decision should consider practical limitations and human judgment as well as model results.
Main question: Which action may be the best option?
Qualitative and Quantitative Data Analysis
Another useful distinction is between qualitative and quantitative analysis. These approaches differ according to the kind of information being examined.
Qualitative Analysis
Qualitative analysis focuses on experiences, opinions, descriptions, and meanings. It is often used with interview transcripts, written feedback, observations, and open-ended survey responses.
Imagine that a mobile application receives hundreds of user reviews. An analyst could organize the comments into themes such as navigation problems, missing features, confusing instructions, or positive experiences.
This process helps explain how people experience a product and what they believe should be improved.
Quantitative Analysis
Quantitative analysis works with numerical information. Analysts may calculate averages, compare percentages, measure changes, or use statistical methods to investigate relationships.
A school could compare examination results across several subjects to identify areas where students may need additional support.
Numerical findings should be interpreted carefully. A difference between groups does not automatically explain why the difference exists, and the quality of the conclusion depends on the data and research method.
Many projects benefit from combining both approaches. Numbers can show where a problem exists, while written feedback can help explain the experiences behind those numbers.
How Does the Data Analysis Process Work?
A successful analysis usually follows a structured workflow. The steps may vary according to the project, but the following process provides a useful starting point.
Step 1: Establish a Clear Goal
Begin by identifying the question you want to answer. A project might investigate declining revenue, customer satisfaction, delivery delays, or changes in website traffic.
A specific question helps determine which information is needed and prevents the analysis from becoming unfocused.
Step 2: Gather the Necessary Information
The next step is to collect relevant data. Sources may include spreadsheets, business databases, surveys, interviews, website reports, or publicly available datasets.
The information should be appropriate for the question being investigated. Collecting unrelated records can create unnecessary work without improving the result.
Step 3: Review and Clean the Data
Raw information often contains errors, repeated entries, missing values, or inconsistent formats. Analysts need to identify these issues and decide how to handle them.
For example, a spreadsheet might list the same customer transaction twice. If both entries are counted, the calculated sales total may be incorrect.
Cleaning requires judgment. An unusual value should be investigated before removal because it could represent a legitimate event rather than a mistake.
Step 4: Explore the Information
Exploratory analysis helps analysts become familiar with a dataset. They may calculate summary statistics, compare categories, create charts, and investigate unexpected values.
This stage can reveal patterns that were not obvious at the beginning and may help refine the original question.
Step 5: Apply Suitable Methods
Once the data has been prepared, the analyst chooses techniques that match the objective. These may include comparisons, trend analysis, statistical testing, or predictive modeling.
The choice should depend on the question rather than on how complicated a particular technique appears.
Step 6: Interpret the Findings
Analysts must explain what the results mean and identify any limitations. A change in one measurement may be associated with several possible factors.
For example, higher sales after an advertising campaign do not prove that the campaign caused the entire increase. Seasonal demand, discounts, and other changes may also have contributed.
Step 7: Communicate the Results
The findings can be shared through a written report, presentation, chart, or interactive dashboard. The format should make the important information easy for the intended audience to understand.
A useful report explains the main result, provides relevant context, and identifies possible next steps.
Step 8: Evaluate the Decision
When the findings lead to a change, the organization can measure the results afterward. This helps determine whether the action worked as expected and whether another investigation is needed.
Which Tools Are Used for Data Analysis?
Several software tools support analytical work. Beginners can start with a simple option and learn more advanced tools as their requirements develop.
Microsoft Excel
Excel is useful for managing tables, calculating totals, applying formulas, filtering information, and creating charts. It is a convenient starting point for many basic analysis projects.
SQL
SQL allows analysts to retrieve and organize information stored in relational databases. It is useful for filtering records, combining tables, and calculating summaries from large collections of structured data.
Python
Python supports data processing, automation, statistical work, and visualization. Libraries such as pandas and NumPy provide tools for working with datasets.
Power BI
Power BI helps users create interactive dashboards and reports. Businesses can use it to monitor performance indicators and communicate results to teams.
R
R is commonly used for statistical computing, research, and data visualization. It can be particularly helpful when a project requires specialized statistical methods.
No single tool is ideal for every task. The best choice depends on the project, the available data, the user’s experience, and the desired output.
Practical Examples of Data Analysis
Example 1: Improving an Online Store
A clothing retailer discovers that its number of completed orders has declined. The owner compares sales by product, device, and traffic source.
The analysis shows that desktop orders have remained stable while mobile orders have fallen. The owner investigates the mobile checkout process and discovers a technical issue that may be preventing some customers from completing their purchases.
After the issue is corrected, the store monitors order completion to assess whether performance improves.
Example 2: Understanding Student Performance
A school examines assessment results from different classes. Teachers notice that students are performing less consistently in one subject.
They review the results alongside attendance information, teaching materials, and student feedback. These findings can help identify topics that deserve additional attention without assuming that every student faces the same difficulty.
Example 3: Managing Inventory
A shop frequently runs out of popular products while holding excess stock of slower-selling items. The owner compares sales history, delivery times, and seasonal changes.
The findings can help the shop plan future orders more carefully. The owner should continue monitoring demand because past purchasing patterns may change.
Common Mistakes to Avoid in Data Analysis
Even carefully collected data can lead to misleading conclusions if it is handled incorrectly.
Ignoring Data Quality
Incorrect entries, duplicate records, and missing information can distort results. Analysts should check the source and preparation process before relying on their calculations.
Using an Unrepresentative Sample
If the information does not represent the group being studied, the findings may not apply to the wider population. The sampling method should be appropriate for the question.
Confusing Correlation With Causation
Two variables may change together without one causing the other. Establishing cause and effect usually requires additional evidence and an appropriate research design.
Choosing Misleading Charts
Poor scales, missing labels, or incomplete comparisons can make results difficult to interpret. Visualizations should represent the information accurately and include enough context.
Overlooking Privacy
Some datasets contain personal or confidential information. Analysts should follow relevant privacy requirements, limit unnecessary access, and protect sensitive records.
What Skills Are Needed for Data Analysis?
People can develop data analysis skills gradually through study and practical experience. Important abilities include logical reasoning, basic mathematics, attention to detail, and clear communication.
Knowledge of spreadsheets helps with everyday tasks, while SQL can be useful for database work. Python, R, and business intelligence tools may become valuable for more specialized projects.
Understanding basic statistics also helps analysts interpret patterns and recognize uncertainty. Technical skills alone are not enough; analysts must be able to explain their conclusions clearly and identify weaknesses in the available evidence.
Beginners can practise by choosing a small dataset, writing down a question, organizing the records, creating a chart, and explaining what they learned. Repeating this process with different datasets builds practical experience.
Frequently Asked Questions
What is data analysis in simple terms?
Data analysis means examining information to understand patterns, answer questions, and support decisions. It turns collected records into findings that people can interpret.
What is the main goal of data analysis?
The goal is to obtain useful insights from relevant information. These insights may help explain past events, investigate problems, estimate future outcomes, or compare possible decisions.
Is data analysis suitable for beginners?
Yes. Beginners can start with spreadsheets, basic calculations, and simple charts before learning programming or advanced statistical techniques.
Does data analysis require coding?
No. Many basic tasks can be completed with spreadsheet software. Programming becomes useful when projects require automation, complex processing, or specialized analytical methods.
Where is data analysis used?
It is used in business, healthcare, education, finance, marketing, transportation, manufacturing, scientific research, and technology.
Can data analysis predict future results?
Predictive methods can estimate possible future outcomes based on historical information. However, their accuracy depends on data quality, model assumptions, and changes in real-world conditions.
Conclusion
Data analysis provides a structured way to examine information, identify patterns, investigate problems, and make informed decisions. Its process includes defining a question, collecting suitable data, checking its quality, applying appropriate methods, interpreting the results, and communicating findings.
From everyday spreadsheet calculations to advanced predictive models, data analysis has applications across many industries. Beginners can develop useful skills by practising with small datasets and gradually exploring tools such as Excel, SQL, Python, and Power BI.
The most important part of successful analysis is not the amount of data collected or the complexity of the software used. It is the ability to ask a clear question, evaluate evidence carefully, and explain what the results can—and cannot—tell us.






One Comment